
 Turnkey Inside
RSI vs Stochastic – Choosing the right technical tools to analyze market momentum is a significant part of developing a consistent trading strategy. While both the Relative Strength Index (RSI) and the Stochastic Oscillator are categorized as momentum oscillators, they operate on different mathematical theories and are used for distinct market conditions.
Many traders mistakenly use them interchangeably, which often leads to missed opportunities or premature exits during strong trends.
Understanding how these indicators differ will help you refine your entry and exit timing. Here are the five main differences you must know to effectively use these tools in your trading.
Read More: Best MetaTrader Indicator for MT4/5, Top Picks
1. Underlying Calculation and Theory
RSI vs Stochastic – The primary difference lies in what each indicator is actually measuring. The RSI, developed by J. Welles Wilder, tracks price momentum by measuring the velocity and magnitude of recent price movements.
It essentially compares the average gains and losses over a set period (usually 14 days) to determine if a move is becoming overextended.
In contrast, George Lane’s Stochastic Oscillator is based on the assumption that as prices rise, they tend to close near the upper end of their recent high-low range.It compares the current closing price to its range over a specific timeframe to identify near-term tops and bottoms.
While RSI measures speed, Stochastic measures position relative to recent price extremes.
2. Sensitivity and Signal Frequency
RSI vs Stochastic – If you prefer frequent trading opportunities, the Stochastic Oscillator is naturally more sensitive. It consists of two lines %K and %D and is designed to fluctuate more sharply between extreme zones. This leads to more frequent signals but also a higher probability of false alarms or noise.
The RSI is a smoother, single-line indicator that produces fewer but often more reliable signals. Because it is less volatile, it is often favored by swing traders or those who want to avoid the choppy signals common with Stochastics in fast-moving markets.
3. Overbought and Oversold Thresholds
RSI vs Stochastic – Both indicators use a scale of 0 to 100, but their standard trigger zones are different.
- RSI: Traditionally considers levels above 70 as overbought and below 30 as oversold.
- Stochastic: Uses 80 as the overbought threshold and 20 as the oversold level.
It is worth noting that in strong trends, these levels can be adjusted. For example, in a strong uptrend, traders might use 80/40 for RSI to account for the sustained bullish momentum.
4. Ideal Market Conditions
RSI vs Stochastic – Your choice between these two should be dictated by the current market regime. The RSI is generally more effective in trending markets because it can handle sustained price moves without giving immediate reversal signals. It provides a cleaner speedometer for trend strength.
Stochastics, however, excel in sideways or range-bound markets. When price is bouncing between support and resistance, the Stochastic’s sensitivity to closing prices makes it ideal for timing entries at the edges of the range.
5. Signal Components and Crossovers
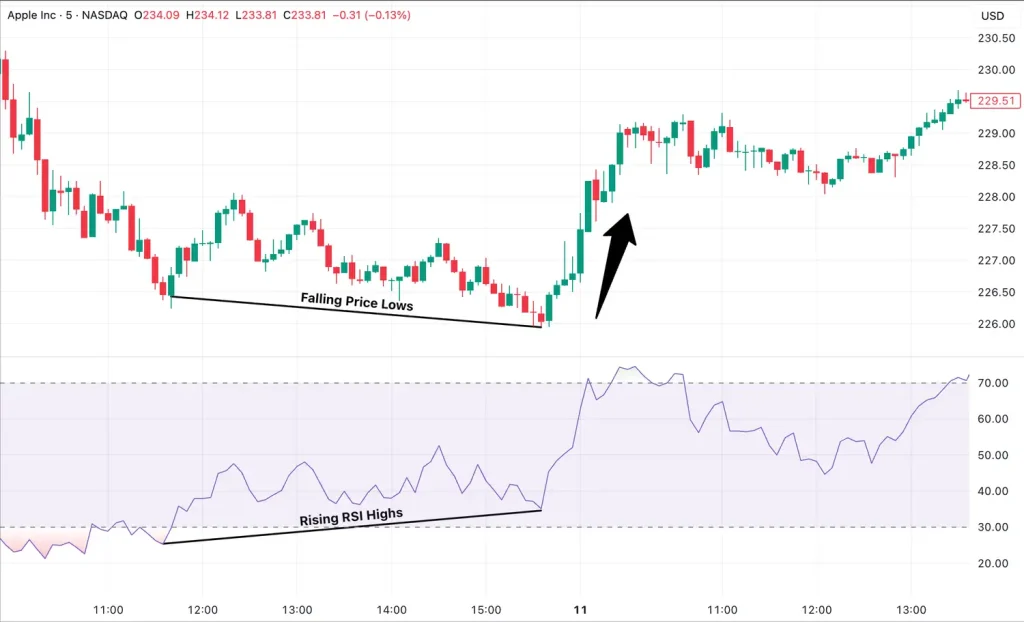
RSI vs Stochastic – Interpreting the signals also requires a different focus. With RSI, traders typically look for the single line crossing key levels or forming divergences with price action.
The Stochastic Oscillator adds the dimension of crossovers. A primary signal occurs when the faster %K line crosses above or below the slower %D line.
This is similar to a moving average crossover and provides an additional layer of timing that the standard RSI lacks.
Choosing the Right Tool for Your Strategy
Your decision depends on your timeframe and goals. Short-term scalpers often favor the responsiveness of Stochastics, while longer-term position traders might prefer the reliability of RSI.
If you find that regular RSI is too slow, you might consider the Stochastic RSI, which is a double-derivative indicator that applies the Stochastic formula to RSI values to create a much more sensitive tool. It is essentially a speedometer for your speedometer.
Read More: The Ultimate List of Broker-Friendly Banks & EMIs
The Future of Technical Infrastructure
RSI vs Stochastic – As trading technology continues to advance into 2026, the focus is moving toward automated systems that can adapt these indicator settings based on real-time volatility. Manual charting is still vital, but having a robust technological backbone is what allows you to execute these strategies without the stress of manual monitoring.
At TurnkeyInside, we understand the technical complexity involved in launching a professional trading brand. We provide the full tech stack, from advanced trading platforms like MT5 to the bridges and CRMs needed to manage your traders effectively.
Ready to launch your own brand? Start your own forex broker with TurnkeyInside today and provide your traders with the professional tools they need to master these market indicators.
